
It doesn’t seem right that one of the most iconic terms in American sports is “Title IX.” A mundane piece of text that seems more appropriate for a classroom of law students rather than the term that is so ubiquitous, even Americans who don’t consider themselves sports fans are familiar with it. Title IX is seen as the backbone of America’s women’s athletics system. Celebrated for all that it accomplished, but also plagued with the misconception that all the success Title IX accomplished for female athletes came at the price of male athletes.
It should be noted that this misconception exists for two reasons. First, because it is very easy to fall into the trap of assuming if money is required to go to female athletes, it must inevitable come from male athletes. Secondly, the biggest culprit in promoting this idea are the sports administrators themselves. High profile administrators of sports hit hard by cuts who would rather blame Title IX than acknowledge the real problem are the failures within their own sport. Their quotes blaming Title IX are frequently repeated by journalists propagating this myth.
The reality is the data overwhelmingly refutes the idea that men’s sports are being hurt by women’s sports. The first evidence of this comes from the way expenses are distributed among the various NCAA levels. The NCAA levels are as follows:
Division I-FBS (FBS)
Division I-FCS (FCS)
Division I-non football (D-I)
Division II (D-II)
Division III (D-III)
It should also be noted that football and basketball are commonly known as the “revenue sports.”
If Title IX were the culprit in causing a decline in men’s non-revenue sports, we would see the lowest level (D-III) having the worst participation rates in men’s non-revenue sports and the best participation rates at the highest level (FBS). The logic being D-III has less money and thus is less able to support non-revenue sports. FBS which is where big time programs such as Alabama football and Duke basketball operate has more money, thus it will have the funds to continue supporting non-revenue men’s sports such as wrestling. The logic follows something that is true for generally every industry. The more money an institution has, the easier it is to comply with regulatory burden.
But when the five NCAA divisions are actually studied to see which level was the hardest hit by cuts to men’s revenue sports, the exact opposite is true. To repeat, not only does the data establish that what should theoretically happen in a situation where Title IX is hurting men’s non-revenue sports is not happening, the data demonstrates the complete inverse is true.
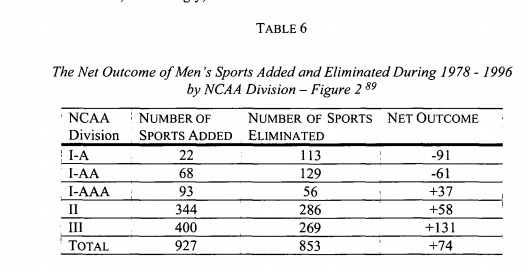
Note: Prior to 2006 the top three NCAA levels of Division I were called (I-A, I-AA, and I-AAA).
The above table was produced by Daniel R. Marburger and Nancy Hogshead-Makar in 2003 for the Marquette Sports Law Review. Olympic sports fans recognize Nancy’s name for her success at the 1984 Olympics and her actions as a lawyer in fighting for awareness on the issue of abuse in sports. She was also a tenured professor who contributed academic research on sports.
So how is the Division with the most money the least able to promote men’s non-revenue sports? The answer is actually quite simple and logical and can be found in the NCAA’s own data.
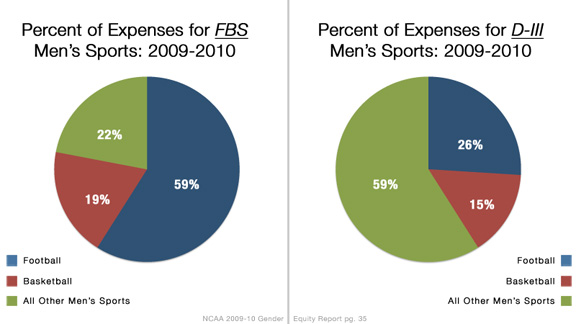
The above graphic speaks to the core issue of understanding why men’s non-revenue sports struggle. At the lowest level (D-III) football/basketball account for 41% of expenses. At the highest level they account for 78% of expenses. The higher up the NCAA hierarchy, the bigger the stakes are in football and basketball. As a result, the bigger the emphasis on those two sports at the direct detriment of the non-revenue sports.
The enemy of men’s non-revenue sports isn’t Title IX, it is actually the men’s revenue sports. As Daniel R. Marburger and Nancy Hogshead-Makar explain:
Because the “marginal benefit” of a dollar spent on football and men’s basketball at the Division I (especially I-A) level exceeds the marginal benefit of the same sports at Divisions II and III, Division I athletic directors have an economic incentive to dedicate a greater proportion of the budget to these sports.
If Division I athletic directors behave as profit-maximizers (or as “budget-maximizers,” whose budget increases and/or salaries are tied to the success of the football and/or men’s basketball teams), then any expenditure on a nonrevenue sport will reduce the athletic department’s profit.
If the athletic director has significant autonomy in decision-making and does not stand to benefit materially from the investment/consumption interests of the university, the incentive is to phase out nonrevenue sports entirely.
Football and basketball programs are constantly trying to one-up each other by trying to exploit the most trivial advantage. Oregon has a portable outhouse. Virtually every major program now has a collapsable tent so the athletes can meet with trainers in private. All of these things do create an athletic advantage, but a trivial one at best. The NCAA atmosphere has descended into a world where athletic departments spend funds on highly ineffective football and basketball tools, but are seen as a necessity because their rivals do the same.

The NCAA is a sports league that revolves around recruiting. Schools do everything to try to win over a prized prospect. The 86 letters UNLV sent a top basketball recruit in a single day only scratches the surface of this trend. Billion dollar sports leagues such as the NBA, NFL, La Liga and the rest of European soccer have some of the wealthiest athletes in the world. Yet it is a handful of NCAA programs that have arguably some of the most luxurious accommodations for its athletes in all of sports.
Big screen TVs and pool tables serve as tools for the current athletes, but also in the realm of recruiting to attract the next generation of players. Title IX takes the blame for the downfall of sports like wrestling, but it is the waterfall in Alabama’s football locker room that did more to hurt the status of men’s non-revenue sports than Title IX ever did.
It wasn’t always like this. The pie chart for the D-III breakdown reflects what the highest level of football was like back in the 1950s and 1960s. But as trends changed the revenue sports started eating up a larger and larger share of the budget in D-I football and that money had to come from somewhere. An athletic department can spend as much as it wants on its football program. Nowhere in Title IX does it require equal spending on men’s and women’s athletics.
In 2006 Rutgers cut five men’s sports. One of those sports was men’s tennis which operated on $175,000 a year. That detail caused considerable controversy as Rutgers had spent an identical amount of money on hotel rooms for the football team, for home games. Yes, you read that right. It was described as “a move meant to make it easier for the team to focus on the game.”
But the optics were terrible. It was a classic example of football programs wasting money in the name of gaining advantages that were cost-ineffective compared to how that money could be spent outside the football program. The cut to five men’s sports came as Rutgers football spending grew from $6.3 million and 26.8% of its athletic budget in the 1998-1999 season to $13 million and 31.7% in the 2005-2006 season. Even politicians got involved with Patrick J. Diegnan Jr. who was one of the most influential politicians on higher education matters publicly rebuking the move.
Rutgers followed the classic pattern of cutting men’s non-revenue sports while simultaneously allocating a greater percentage of its budget to revenue sports like football. Rutgers was criticized for it, but in the end Rutgers had calculated correctly. A few years later Rutgers joined the Big Ten.
It came on the heels of a conference-wide reshuffling that left some schools without a major conference. For those schools, the consequences were devastating. For Rutgers it was the equivalent of a peasant becoming a king. The Big Ten is an athletic conference, but the move will have significant academic benefits as well. Big Ten football will not only funnel hundreds of millions of dollars into Rutgers athletics that it wouldn’t have otherwise had, but billions of dollars on the academic side as well.
The big time sports programs of the NCAA are essentially branding campaigns that have significant ramifications on the academic perception of the school. Academic dollars such as federal research grants make athletic revenue look like leftover change. The athletic and academic value of the Big Ten invite which came on the heels of sacrificing sports such as men’s tennis for football will end up going down as one of the best decisions ever made in NCAA sports administration.
Another critical piece of evidence dispelling the myth of Title IX comes from the years 1984-1988. In 1984 a Supreme Court case Grove City v. Bell gutted Title IX and prevented it from applying to athletics. It wasn’t until 1988 that Congress responded with a workaround bringing Title IX back into the fold of athletics. This left a four year window of Title IX not applying to college athletics that can be studied to see how NCAA athletic departments behave without Title IX.
Wrestling was particularly hard hit during that four-year gap losing 53 programs. It represented the era where the sport saw some of its worst decline. It wasn’t until after the restoration of Title IX that its rate of decline became less extreme.
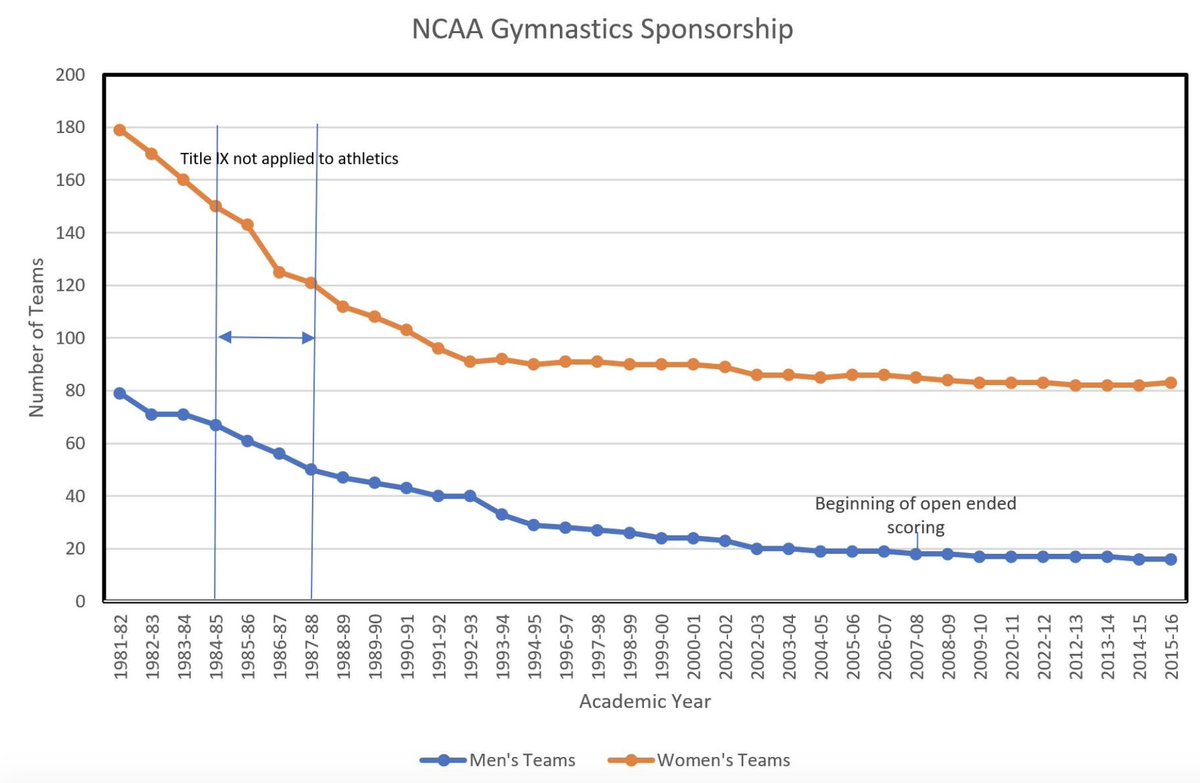
A graphic from @OnoNoKomachi1 compiled the rate of decline in gymnastics which demonstrated a similar trend. The fall of men’s gymnastics continued through the four-year gap and the rate of decline didn’t begin to slow down until Title IX’s restoration to applying to college athletics.
And then there are the three prongs which are the first example of the misconception regarding Title IX being built on other misconceptions. The three prongs are:
1. Proportionality Test: Provides a composition of athletic opportunities to men and women that is proportional to the gender composition of the student body.
2. Program Expansion Test: Demonstrate consistent program expansion for women.
3. Accommodation of Interest Tests: Show accommodation of student interests or abilities.
In order to be in compliance with Title IX, a school only needs to be in compliance with one of these prongs. It is Prong #1 that gets virtually the entirety of the attention when Title IX is discussed, but a school can still be in compliance via the other two prongs. Contrary to popular thought, if a school isn’t in compliance by having a proper proportional representation of male and female athletes, cutting a men’s sport to meet proportionality is not its only recourse. It has other recourses that are far easier to come into compliance. Specifically, it simply has to show progress in expanding opportunities for women. And that “progress” can be over the course of decades.
Deborah Anderson and John Cheslock have conducted some research on this topic and was summarized in this Forbes article.
But even though the authors gave the schools some leeway, most schools still couldn’t reach compliance. When these authors looked at data from the mid-1990s — or 20 years after Title IX was passed — at least 90% of schools still were not in compliance according to the proportionality gap. A few years later — from 2001 to 2002 — Anderson and Cheslock reported that more than 80% of schools were still not in compliance and the average proportionality gap was still 13%. Averett and Estelle looked at data from 2009 — or 30 years after the Department of Health, Education, and Welfare established its test — and it was still the case that more than 80% of schools were not in compliance.
So why aren’t schools in compliance? Theoretically a school would lose federal funding if it didn’t comply with Title IX. But Averett and Estelle note that this has never happened. Yes, the law says you must comply. But you can reach compliance with the other two prongs. In other words, even though you never reach proportionality, a school can claim it is in compliance by saying it is either making progress (even if that “progress” is taking decades) or satisfying the demand of women on campus.
One thing to note is Anderson and Cheslock’s figures give schools 3% to 5% leeway to meet compliance with the proportionality test. Even with that leeway 80% to 90% were still not meeting proportionality. But the most important takeaway that I’m going to repeat:
Theoretically a school would lose federal funding if it didn’t comply with Title IX. But Averett and Estelle note that this has never happened.
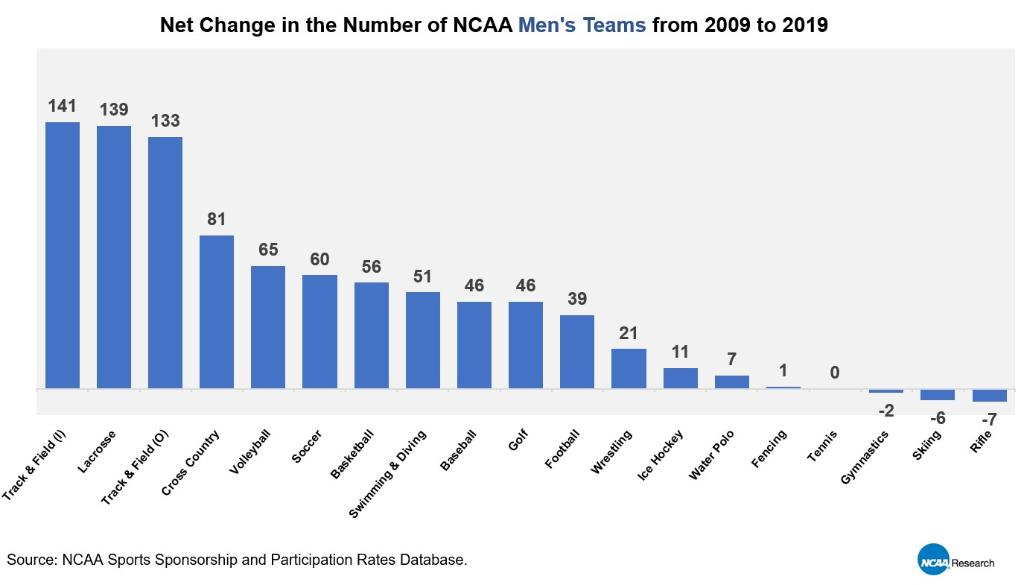
The graphic above and the graphic below are taken from the NCAA’s research Twitter account. What makes them so relevant is the pattern they demonstrate. The same sports that struggle on the men’s side, are the same sports struggling on the women’s side.
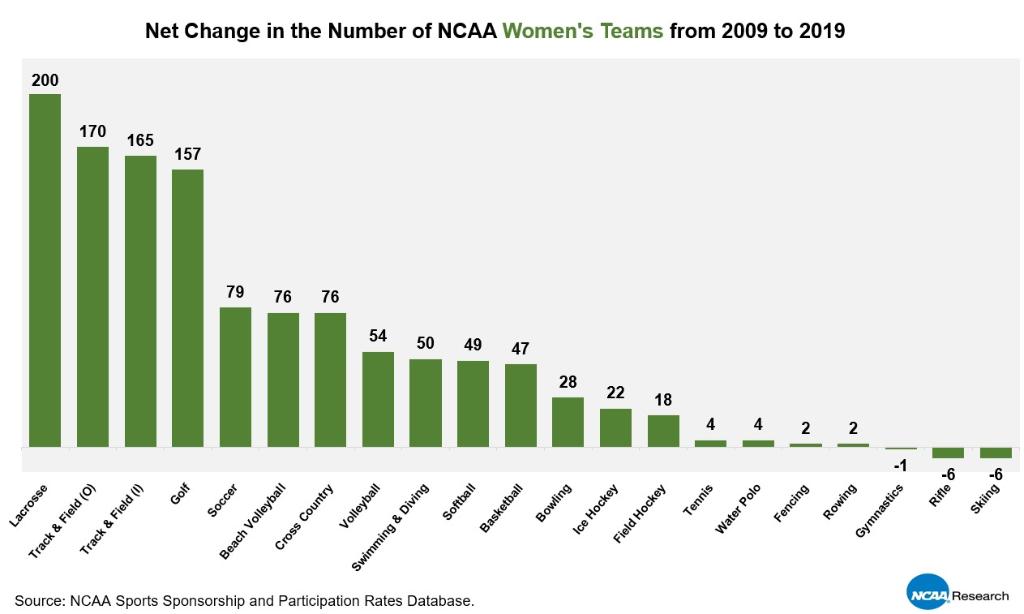
The three sports with the largest net loss are the same for both genders. Gymnastics, rifle, and skiing. Of the seven worst performing women’s sports in the graphic, six of them are NCAA men’s sports. They are the same six sports that have the worst showing on the men’s graphic. Gymnastics, rifle, fencing, water polo, tennis and skiing.
Gymnastics is perhaps the best example of this. Men’s gymnastics has the distinction of being the hardest hit men’s sport by general cuts. From 1981 to 2001 men’s gymnastics went from 79 teams to only 21 teams. But in that same time period women’s gymnastics went from 179 teams to 90 teams.
When sports have either low levels of growth or get cut, it frequently is true for both genders, absolving Title IX of blame in the process. And this is why so many people believe that Title IX is the reason for the downfall of men’s gymnastics and wrestling. For sports administrators who are tasked with promoting these sports, they don’t want to acknowledge that the real reason their sport is struggling has to do with problems such as a lack of popularity. That rising insurance rates and equipment costs are pricing institutions out of the sport. Sports administrators don’t want to admit that other sports have become better and more attractive options for athletic departments. So they go looking for something else to blame. Title IX is an easy target. Ripe with misconceptions that its opponents can easily exploit. Prone to simple logic that makes sense at first glance, but breaks down when it is thoroughly analyzed.
Title IX is one of the most popular pieces of legislation to come out of Congress in modern history. It is popular not because the misconceptions are so widely believed, but in spite of them being widely believed. As Americans see it, the price on men’s athletics is a price worth paying to open up opportunity for women’s athletics. Not realizing the price on men’s athletics is actually no where close to what people believe it to be. A couple of cherry-picked examples don’t offset the reality that 74 more teams were added than lost in men’s athletics in the aftermath of Title IX.
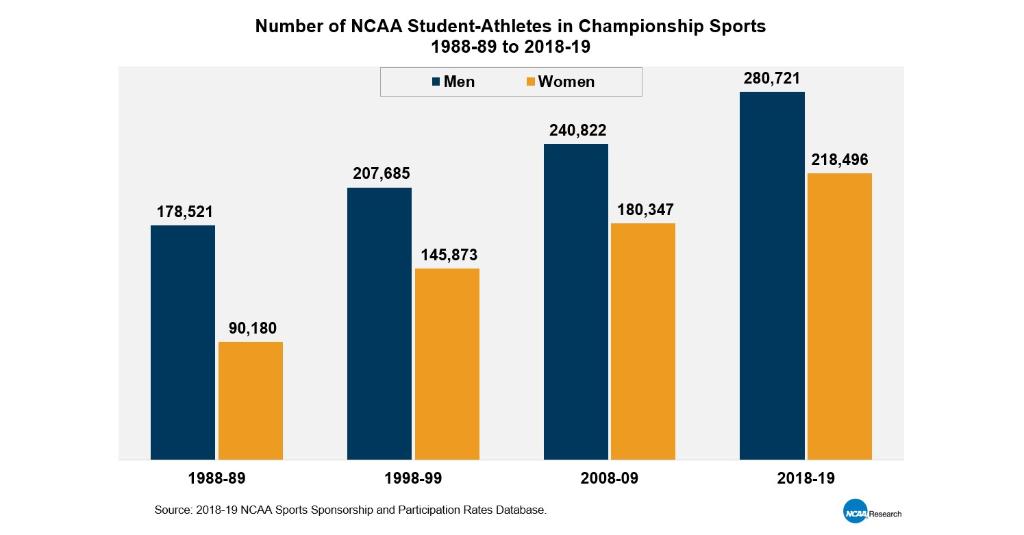
There is obviously some cost that the rise of women’s athletics had on the men’s side. But it’s not anywhere close to what it is commonly made out to be. Men’s NCAA sports are not in a state of decay. They are actually thriving. There are still far more male athletes than female athletes in the NCAA. While the women’s side has had a higher rate of growth since the 1970s, in very recent times the men’s side has actually added more athletes by a narrow margin.
College athletics has come a long way from the days of the Yale rowing team taking their clothes off in front of a New York Times reporter to demonstrate the unfairness of not being given access to showers after a practice session on the cold water while the men were. Then there are women’s college basketball players being told the men get food after their games while the women don’t because “they didn’t play as hard.” Or their high school equivalents who were told they were relegated to half-court basketball because full court basketball would make girls exert themselves too much.
Concepts that seem more appropriate for the 1930s than the 1970s. But that was what made Title IX necessary in the first place and figures showing that to this day women still haven’t achieved true proportionality demonstrate why it still is.
