
Data Crunch #10
Every since I started TMC I have been working towards finding a metric that determines who were the most dominating All-Around (AA) champions in gymnastics history. First I used margin of victory, on my second attempt I analyzed apparatus rankings, and finally I measured a strong performance based on how many medals each AA Champion won in Event Finals.
None of these three metrics are better than the other. In fact, some of them measure fundamentally different things such as Event Finals (how well did an AA Champion performed throughout an entire competition) whereas others focused exclusively on the AA. But there was one fundamental flaw to all three of these metrics.
Women’s Artistic Gymnastics (WAG) is highly prone to a particular era skewing the data. The typical of margin of victory in a WAG competition has fluctuated heavily over the years. The rise of specialization in recent decades makes it harder to compare the versatility (ability to win on multiple apparatuses) of modern athletes to Cold War era athletes. And a reduction in size to the AA format as well as the addition of country limits skews the ability to fairly measure apparatus placement.
This article will be my fourth attempt and is something I have nicknamed “AA Showdown.” It is my personal favorite way of measuring success and is what I feel is the most effective way to do it.
How it works is by directly comparing the scores of the winner and runner-up of a particular competition. Rather than adding the total scores, the scores will be measured on a routine-by-routine basis. Gymnasts can compete in up to four different stages in a single competition. There are two days of team competition, an All-Around, and an Event Finals. With four stages and four apparatuses in each stage, there are 16 possible routines a gymnast can perform in a single competition. I will label each of these 16 possible routines as a “round.”
Whichever gymnast puts up a higher score in a particular round, wins that round. For example Simone Biles’ vault score in 2016 Team Qualifications will be compared to Aly Raisman’s vault score in 2016 Team Qualifications. The number of rounds a gymnast wins will reflect how dominant or how close the overall performance was. I will then compare the winner and runner up on a +/- or plus/minus basis. If an AA Champion has a “+3” that means she won three more rounds than the silver medalist. The results are below:
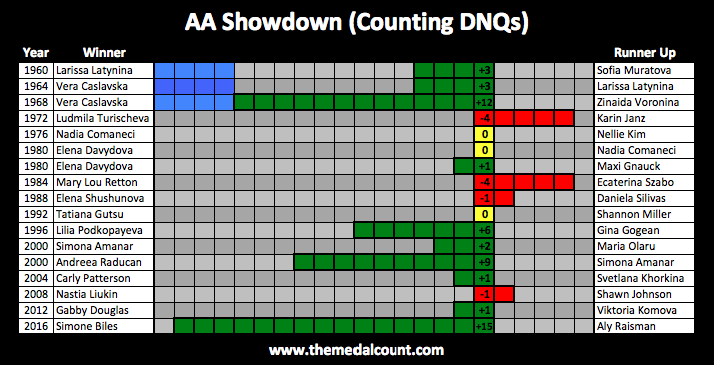
What I love about this particular metric is that the results come very close to matching the overall popular perception fans have. Competitions such as 1980, 1988, 1992, 2008, and 2012 are the most heavily debated AA results amongst gymnastics fans. They are widely perceived to be some of the most evenly matched showdowns in WAG history, and the data reflects that they truly were close contests.
If this metric fails to achieve its initial goal by demonstrating the most impressive wins in WAG history, at the very least it has helped identify which were the most evenly matched competitions in WAG history. But there are some things you are probably wondering.
There are two results for both 1980 and 2000. This is because the AA silver medal was shared in 1980 resulting in two runner ups (Maxi Gnauck and Nadia Comaneci). In 2000 there is an official (Simona Amanar) and an unofficial winner (Andreea Raducan) due to a medal being striped. I decided to include both winners in the data.
The blue in the top left corner represents rounds that are “unavailable” as either those rounds weren’t contested back then, or individual scores aren’t available. This is one the drawbacks to this particular metric. It requires individual scores of every round which aren’t always available, thus making it difficult to calculate results for the World Championships. Another issue is that the Olympics only had 12 rounds prior to 1972 and only 8 rounds prior to 1960. The blue color represents the maximum score gymnasts of the 1960s could achieve out of 12 rounds.
You will probably notice the data declares Nellie Kim and Nadia Comaneci to have been evenly matched in 1976, even though it is one of the most dominating wins in WAG history. This is the one glaring flaw for this particular metric. It works great…when it works. I don’t think 1976 proves the rest of the metric is flawed, but rather when certain conditions are met, the metric produces an error. The 1976 Montreal Olympics are essentially a “you can’t divide by zero” situation.
The problem is that Nadia was an exceptionally talented bars and beam worker. Nellie was a dominant vaulter and floor worker. Not only did Nadia/Nellie have polar opposite strengths, but they were historic on their two respective events. Nellie was the last gymnast to win an Olympic gold medal on floor in two different Olympics while also being one of the few WAGs to have won the vault title at both the Olympics and the World Championships. Nadia is in the only gymnast to have won two Olympic gold medals on beam. She also won a gold medal on bars at the Olympics and two more at the European Championships.
Each gymnast dominated their two respective events and neither had the opportunity to usurp the other, resulting in a 50% split all across the board. The philosophy of this metric rests on finding a common event for the two gymnasts to separate themselves, and there was no common event to be had for Nadia and Nellie. For that reason I’d chalk 1976 up as a freak situation.
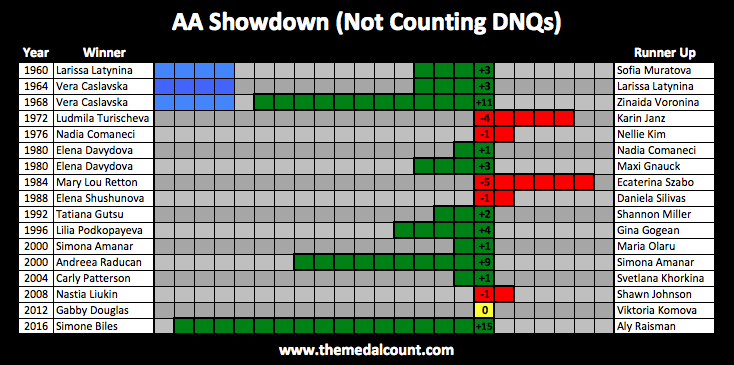
In the above graphic you may have noticed the title dictating DNQs counting/not counting. The term DNQ stands for “Did Not Qualify” and designates the rounds in which one gymnast competed, whereas the other didn’t. An example of a DNQ is Nadia advancing to beam finals at the 1976 Olympics, but Nellie Kim did not. Thus only Nadia contributes a score to the data. There are two different ways to approach this situation.
(1) Don’t count the DNQ: Under this scenario since Nellie Kim doesn’t have a score, Nadia’s score well be dropped as well and the entire round becomes a draw.
(2) Count the DNQ: Under this scenario Nellie Kim’s DNQ would be entered into a data as a 0.000 and be treated as a win for Nadia.
The benefit to the first option is that it satisfies the goal of this project which is to find who the best gymnast was at a competition, in spite of the final results. The purpose is to identify things like which gymnasts won because their opponents had a fall. Which gymnasts were clearly the most talented gymnasts at the entire competition despite not winning the AA. And finally, who was the best gymnast in all four stages of a competition from the first day of the team competition to the end of Event Finals.
Option #1 is counterproductive to that goal and is especially problematic as it does what the final results do, it emphasizes the falls/mistakes. If a gymnast falls on an apparatus in the team competition, she not only loses that round in the team stage, but it may also cost her a second round it she fails to qualify on that apparatus in Event Finals. She effectively gets penalized twice for a single error.
The most notable case of this occurred during the 1984 Olympics when Ecaterina Szabo botched her bars routine in Team Optionals. This not only gave Mary Lou Retton a win in that particular round, but an additional win in Event Finals. This in spite of Szabo clearly being the superior bars worker. Szabo recorded a higher bars score in both Team Compulsories and again in the AA while being the reigning silver medalist at the World Championships. Szabo almost certainly would have beaten Retton had she qualified for Event Finals.
Option #2 solves the first problem by allowing a gymnast to be forgiven for an error by not penalizing her twice. But it comes with a catch, it creates an asinine situation where it is actually to the advantage of a gymnast to record a lower score. This was the case with Nellie Kim in the 1976 beam finals. Had Nellie put up a higher score and advanced to beam finals, she would have lost to Nadia.
But by recording a lower score, she is eliminated from the round entirely and takes away Nadia’s chance to win, costing Nadia a winning round in the process. In sports it is sacrilegious to create a situation where there is an incentive to record a lower score, but this metric does exactly that. Even worse, by taking away a winning round from Nadia, Nellie actually finishes ahead of Nadia in the overall standings and wins 1976! The fact that this data declares Nellie Kim the better gymnast in 1976 reflects its drawbacks.
While it measures the success of a gymnast in a way that eliminates era bias, the core philosophy of this metric requires certain conditions to be met in order to function properly. On the rare occasion that those conditions are absent, the entire metric breaks down and produces an absurd result.
To simplify things: The first option makes sense for Nellie Kim in 1976, but not Szabo in 1984. In the second option the reverse is true. It is up to the readers to determine which option they like better.
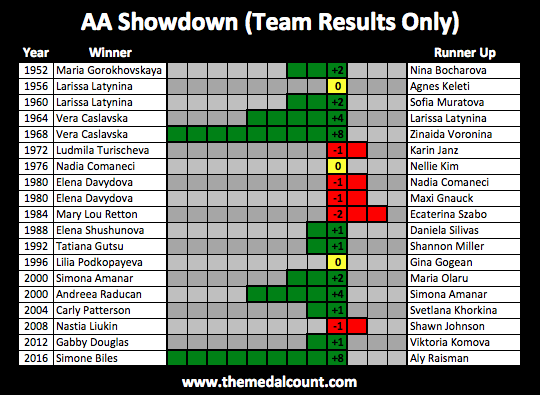
I created yet another graphic, but this one is completely different from the other two. It takes only the rounds (8 in total) from the team competition. This mostly eliminates the problem of gymnasts failing to qualify to an Event Finals, but there are still “missing” routines. This is due to changes to the team format starting in 1996 that no longer require every gymnast to compete on every apparatus during the various stages of the team competition. Thus there are cases where a gymnast recorded a Did Not Start (DNS) which is identical to a DNQ in the data. Examples of this are Nastia Liukin on vault in 2008 Team Finals and Aly Raisman on bars in 2012 Team Finals.
The benefit of capping the data to include only the rounds of the team competition has two purposes. First to keep the number of DNQs as low as possible. Secondly to create a more cohesive dataset. This third dataset ensures that every gymnast is kept to the same standard. From 1952 to 2016, the highest possible score for every Olympic Champion is +8. It also makes it fair to incorporate the 1950s into the data, which I wasn’t comfortable doing in regards to the first two graphics as they didn’t have any individual events besides the team competition.
Note: They had individual medals, but they were based off of score from the team competition.
While it may seem strange to readers that I’m using team results to rank gymnasts in the AA, the purpose of this project was never to specifically analyze AA performance, but performance throughout the entire competition as a whole. I wanted to find cases where a gymnast clearly outperformed her opponent, but failed to win due to an ill-timed fall or a critical mistake. I wanted to show who was the best gymnast that showed up at the competition rather than simply who won the competition.
The data makes it very clear that Mary Lou Retton is the worst performing AA Champion in Olympic history. While the Retton result may not be all that surprising to fans, the 1972 result is the most shocking result in the data. But there are some interesting things to note about 1972.
The 1972 All-Around remains the only time in Olympic history that the two best gymnasts tied in qualifying. It can jokingly be called the first Olympic AA with new-life scoring. Ludmilla Turischeva and Karin Janz were evenly matched for most of the competition. But it was in Event Finals (EF) where Turischeva fell apart.
Turischeva had the highest qualifying score on vault, but had the lowest score in EF. Carry-over scoring bumped Turischeva up to a bronze. That would set the tone for an Event Finals that was marked by further ill-timed mistakes for Turischeva that cost her dearly in the final standings. It didn’t help that this was the EF where Olga Korbut experienced breakout success and the crowd focusing on Korbut was almost certainly to Turischeva’s detriment.
But credit also must be given to Karin Janz who demonstrated incredible poise in both 1972 Event Finals and throughout her entire career. Janz’s seven career Olympic medals is a testament to her immense talent and status as a gymnast capable of giving legends like Turischeva a bad day. Even without Turischeva’s implosion in EF, Janz still would have beaten her in the data.
One further thing to note is that country limits weren’t introduced for EF until 1976, and gymnasts last competed only 12 routines in 1968. What this meant was 1972 featured a unique format compared to other entries in the data. But whether this caused the absurd result of -4 from Turischeva is difficult to answer. But it was something the reader should at the very least be informed about as a possible explanation.
